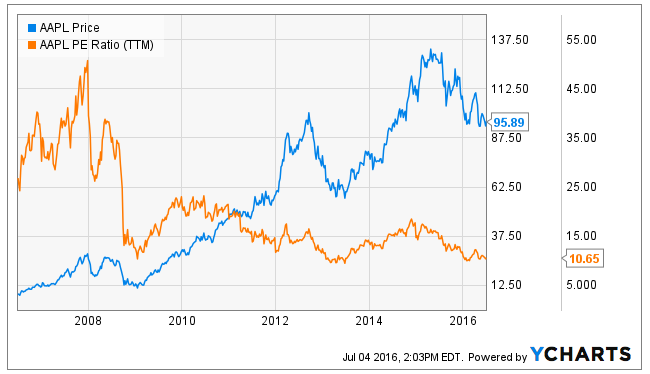
For a stock like Apple Inc. (NASDAQ: AAPL) which is so vastly covered and closely tracked by analysts, it can be reasonably expected that the near-term to mid-term forecasts have been baked into the price. Earnings for the next 12-18 months are priced (with fair deviations) into the stock, which is $95.89 as of Friday’s close. Drastic fluctuations from these forecasts will result in huge swings for the stock.
Apple Inc. (NASDAQ: AAPL) is due to report its earnings on 26th July 2016. Hopes are pretty low from the upcoming results, and for the next couple of quarters as well. So, what is it that will reward investors going forward? Since all of the bad news has already been discounted in the share price, any positive will excite the stock higher.
Apple’s PE is near a 10-year low at 10.65. The dividend yield is also competitive at 2.38%. Even if not for the capital appreciation, Apple is a great dividend income opportunity as well.
But, gladly, we can say that there is strong technical evidence that a big breakout is on its way for Apple investors. We have deliberately used the monthly Apple price chart as it smooths out the trajectory, and dismisses the noise.
In April last year, Apple traded at a life-time high of $134.54, and has since been trapped in a Descending Triangle pattern, which is actually a bearish technical pattern. Market participants who have been closely watching the price action are searching for a close below the base line or support (the lower horizontal line) to initiate short positions. But there is a twist to this tale. It seems highly likely that the breakout will be on the upside rather than downside, and we may see Apple revisiting $120 – $125 again.
Now, why would this happen? History often tends to repeat itself in the stock markets. We humans tend to behave in a similar manner in similar situations. By similar situations here, we want to direct you to the Money Flow Index and Relative Strength Index numbers.
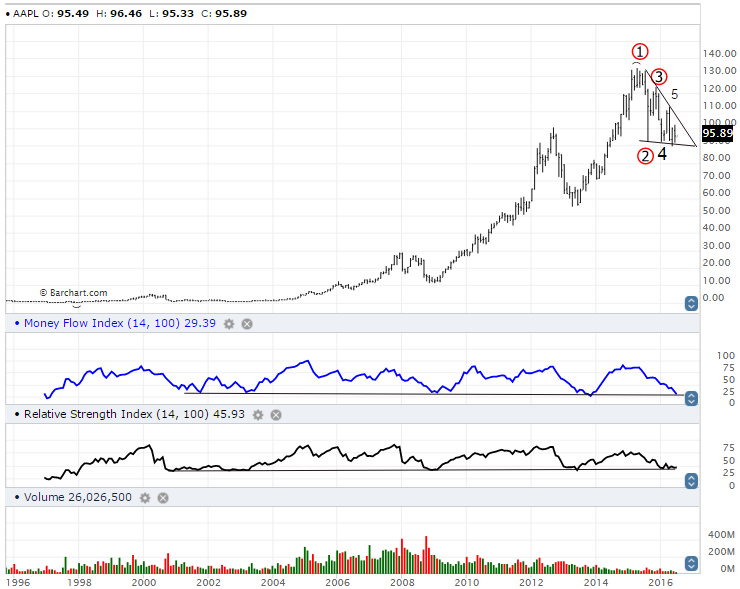
Source: BarChart
From the above chart, it can be clearly seen that the 14-month MFI reading of 29.39 is at its 15-year support. MFI of 20 or below suggest oversold conditions. Whenever the MFI has touched this support, a strong rebound has been witnessed both in MFI and the price.
A similar bullish observation can be made by looking at the 14-month RSI of 45.93, which is again at its 15-year support.
The two technical indicators confirm that the market is fooling speculators into believing that a downside is coming, when instead, it is preparing for a huge surge in the coming months.
All the expected developments have been reflected in the chart above, which says that unless the broader market declines substantially, Apple only has higher to go from here.
The charts represent the psychology of the investors. With time, what investors are willing to pay for a stock keeps shifting higher (if the business is profitable), and technical indicators help us ascertain those price levels where one can safely invest. Investors can safely invest in Apple at current levels.
What If Things Go Wrong?
Our assumption that the breakout will eventually be on the upside is at risk due to the high volatility in the global markets, Apple significantly overpaying for the Tidal deal, and actual earnings coming starkly lower than the forecasts.
Any of these events can demoralize investors and they can shun the stock in despair. $90 has seen repeated buying for the past one year now, and it represents that investors feel safe at this level. A breach below this may cause panic among the short-term and medium-term investors, and intensify the selling pressure. There are no downsides in a panic environment, so it is hard to comment, but if technical analysis were to be applied, we may see at least $70 – $80. I am expecting this to happen only if the entire US market falls in tandem.